Cost of Living in South Korea 2026: Rural vs National
By the RuralRoof Editorial Team · Last updated 2026-10-25 · 5 official sources
The cost of living in South Korea averaged ₩2.94 million a month per household in 2025, according to the national household spending survey. Rural farm households spent less, at about ₩2.68 million.
This guide compares the two official surveys line by line. It shows where countryside costs fall (rent, eating out, education) and where they rise (food at home, health), plus regional income from Seoul to the provinces.
- The average Korean household spent ₩2,939,000 a month on consumption in 2025, for 2.19 people [1].
- Farm households spent ₩32.14 million in 2025, about ₩2.68 million a month, for 2.27 people [2] [3].
- Housing and utilities cost farm households about ₩202,000 a month, against ₩361,000 nationally, which includes ₩126,000 of rent [1] [2].
- Seoul's household disposable income per head was ₩32.22 million in 2024, against ₩24.86 million in Gyeongbuk [4].
How much does it cost to live in South Korea per month?
About ₩2.94 million per household. The national survey states that consumption spending averaged ₩2,939,000 a month in 2025, up 1.7% on 2024 [1].
The average household had 2.19 members. The figure covers households of one or more people, including farm, forestry and fishing households [1].
“In 2025, average monthly consumption spending per household was 2,939,000 won, up 1.7% on the previous year.”
The latest quarter is similar. In the second quarter of 2026, the average household spent ₩2,932,317 a month, with 2.16 members [5].
Consumption excludes taxes, pension contributions and social insurance. The survey records those separately as non-consumption spending, ₩1,076,000 a month in 2025 [1].
Is it cheaper to live in rural Korea?
Yes, on the official averages. Farm households spent about ₩2.68 million a month in 2025, roughly 9% less than the national ₩2.94 million, while housing slightly more people [1] [2] [3].
The farm survey counts a depreciation allowance (감가상각비) of ₩4.81 million a year inside consumption [2]. The national table has no such line. Without it, farm spending is about ₩2.28 million a month [2].
| Item | All households | Farm households | Difference |
|---|---|---|---|
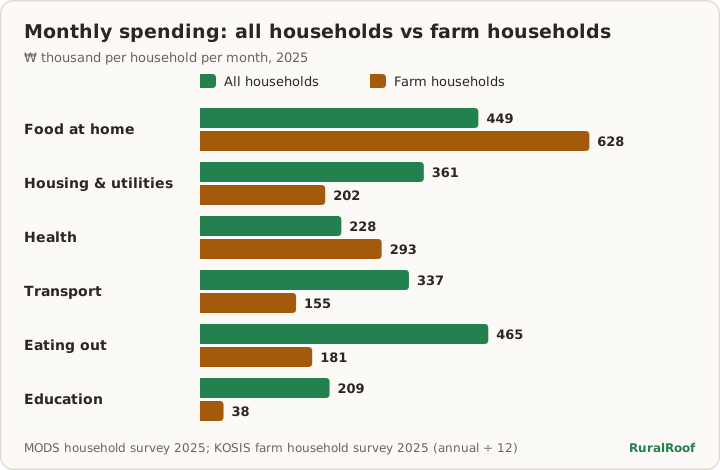
| Food and non-alcoholic drinks | ₩449,000 | ₩628,000 | +40% |
| Housing, water, electricity, fuel | ₩361,000 | ₩202,000 | −44% |
| Health | ₩228,000 | ₩293,000 | +28% |
| Transport | ₩337,000 | ₩155,000 | −54% |
| Eating out and accommodation | ₩465,000 | ₩181,000 | −61% |
| Communication | ₩167,000 | ₩92,000 | −45% |
| Education | ₩209,000 | ₩38,000 | −82% |
| Total consumption | ₩2,939,000 | ₩2,678,000 | −9% |
The two surveys use different samples and methods. Read the gaps as direction and size, not exact prices. A foreign buyer in a village is also not a farm household, so some lines will differ.
Why are housing and utility costs lower in the countryside?
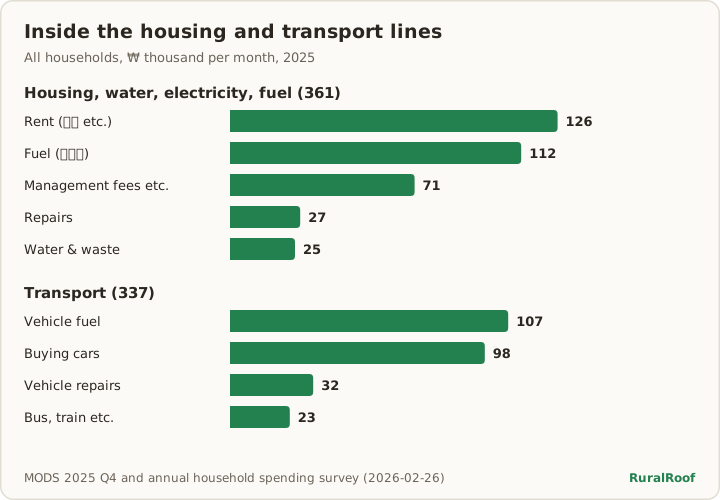
Mostly because farm households rarely pay rent. Nationally, ₩126,000 of the ₩361,000 housing bill is actual rent, such as monthly rent (월세) [1].
The national housing line also includes ₩71,000 of other housing services, such as apartment management fees. Fuel for heating and cooking was ₩112,000 a month [1].
| Sub-item | Monthly | Share |
|---|---|---|
| Actual rent (월세 etc.) | ₩126,000 | 35.0% |
| Fuel (연료비) | ₩112,000 | 31.0% |
| Other housing services (management fees etc.) | ₩71,000 | 19.7% |
| Repairs and maintenance | ₩27,000 | 7.4% |
| Water, sewerage and waste | ₩25,000 | 6.8% |
Farm households spent about ₩202,000 a month on the whole category in 2025 [2]. The KOSIS farm table does not split out fuel, so the heating share for farm homes is not published there.
Which costs are higher in rural Korea?
Food bought for home and health. Farm households spent about ₩628,000 a month on food and drinks, against ₩449,000 nationally, and ₩293,000 on health, against ₩228,000 [1] [2].
The pattern flips for meals out. Eating out and accommodation cost farm households about ₩181,000 a month, against ₩465,000 for all households [1] [2].
Taken together, food at home plus eating out is about ₩809,000 for farm households and ₩914,000 nationally [1] [2]. Rural households cook more and eat out less.
Health spending covers medicines, outpatient and dental care, and hospital stays [1]. The figures show what households paid, not travel time to a clinic, which the surveys do not measure.
How much does running a car cost in rural Korea?
Nationally, car-related spending was about ₩237,000 a month in 2025: ₩98,000 buying cars, ₩107,000 on fuel and ₩32,000 on maintenance and repairs [1].
Public land transport, such as buses and trains, was only ₩23,000 a month on the national average [1]. A rural move usually shifts spending toward the car lines.
Farm households reported ₩155,000 a month for transport [2]. However, part of a vehicle's cost may sit in the farm survey's separate depreciation line, so the two transport figures are not like for like.
How does Seoul compare with rural provinces?
Seoul households have more to spend. Household disposable income per head was ₩32.22 million in Seoul in 2024, against a national ₩27.82 million [4].
Every province (도) except Gyeonggi sat below the national figure. Gyeongbuk was ₩24.86 million, Gangwon ₩25.24 million and Jeonnam ₩26.80 million [4].
| Region | Per head | National = 100 |
|---|---|---|
| Seoul | ₩32.22 million | 115.8 |
| National | ₩27.82 million | 100.0 |
| Jeonnam | ₩26.80 million | 96.3 |
| Chungbuk | ₩26.55 million | 95.4 |
| Gangwon | ₩25.24 million | 90.7 |
| Gyeongbuk | ₩24.86 million | 89.3 |
| Jeju | ₩24.61 million | 88.5 |
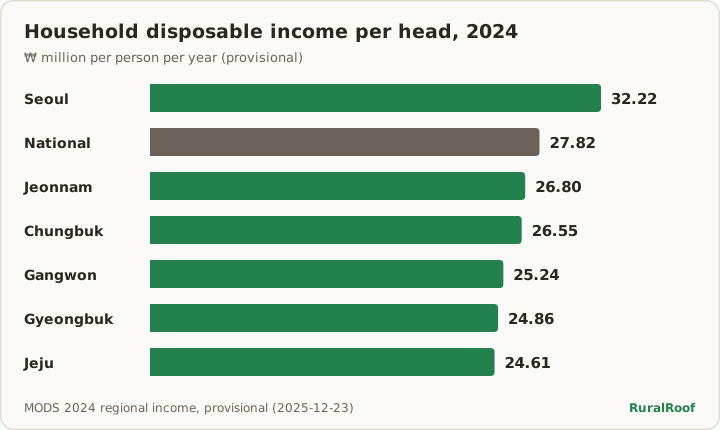
Seoul's figure is about 30% above Gyeongbuk's [4]. The release reports income, not prices, so it does not show how much cheaper daily life is in each province.
How should you budget for a move to rural Korea?
Start from the national average and adjust the lines that change in the countryside. The process below uses only the survey categories cited above [1] [2].
- Take ₩1.34 million per person a month as the national starting point [1].
- Remove rent if you buy, and add your own heating fuel estimate for the house [1].
- Add car fuel, insurance and repairs; national car lines alone were about ₩237,000 a month [1].
- Raise food at home and lower eating out, as farm households do [2].
- Keep a health line at least at the national ₩228,000 a month [1].
Running costs are one part of buying. Work through the rural house checklist, read buying a house in South Korea and residence after buying, then browse rural listings or use address search.
Frequently Asked Questions
What is the average cost of living in South Korea per month?
Average household consumption spending was ₩2,939,000 a month in 2025, for 2.19 people [1]. In the second quarter of 2026 it was ₩2,932,317 [5].
How much does a single person spend per month in Korea?
Dividing the 2025 household average by household size gives about ₩1.34 million per person a month [1]. One-person households appear separately in the KOSIS table [5].
Is the countryside cheaper than the city in Korea?
Farm households spent about ₩2.68 million a month in 2025, against ₩2.94 million for all households [1] [2]. The gap comes mainly from rent, eating out and education.
What do rural Koreans spend more on?
Food bought for home (about ₩628,000 a month against ₩449,000) and health (₩293,000 against ₩228,000) [1] [2].
Does the average include taxes and pensions?
No. Consumption spending excludes them. Non-consumption spending, such as taxes and social insurance, was a further ₩1,076,000 a month in 2025 [1].
Related articles
- Rural House Checklist for Korea: 8 Records to Check (2026)
- Landlocked Land (맹지) in Korea: Road Access Rules (2026)
- Korea's Rural Empty House Bank: How It Works (2026)
- Rural Second Home Tax in Korea: Keep One-Home Relief (2026)
- Nongmak vs Rural Stay Shelter in Korea: 2026 Farmland Rules
- Unregistered Buildings (미등기 건물) in Korea: Buyer Risks (2026)
- Farmland Acquisition Certificate (농취증) in Korea: 2026 Guide
- Build a House on Farmland in Korea: 2026 Permit Guide
- What Is a Farmhouse in Korea? 농가주택 Legal Meaning 2026
- Cheap Rural Houses in Korea: Real Prices and Costs (2026)
- Rural House Renovation Cost in Korea: Permits & Aid (2026)
- Free Empty House Rent in Rural Korea: What Exists (2026)
- Return-to-Farm Support in Korea: 2026 Loans and Grants
- Return-to-Farm Reality in Korea: 2026 Survey Numbers
- Farmland Disposal Order in Korea (농지 처분명령): 2026 Guide
- Rural House Acquisition Tax in Korea: 2026 Rates Guide
- Buying a House in South Korea as a Foreigner: 2026 Rules
- Alien Registration in Korea After Buying a House (2026)
- Can Foreigners Buy Property in Japan? 2026 Akiya Bank Rules
General information, checked against the official sources below on the date shown. No sponsored content: no office, organization, agent or seller named here paid for or reviewed this page. Rules change, so confirm with the office named or a specialist (a licensed agent or a lawyer) before you sign.
Sources
- [1]2025년 4분기 및 연간(지출) 가계동향조사 결과 (2025 Q4 and annual household spending survey results), released 2026-02-26 · Ministry of Data and Statistics (국가데이터처), via korea.kr · accessed 2026-10-25
- [2]농가경제조사: 가계지출 (Farm Household Economy Survey: household spending), 2025 · Ministry of Data and Statistics, KOSIS · accessed 2026-10-25
- [3]농가경제조사: 주요지표 (Farm Household Economy Survey: main indicators), 2025 · Ministry of Data and Statistics, KOSIS · accessed 2026-10-25
- [4]2024년 지역소득(잠정) (2024 regional income, provisional), released 2025-12-23 · Ministry of Data and Statistics (국가데이터처), via korea.kr · accessed 2026-10-25
- [5]가구원수별 가구당 월평균 가계수지 (Monthly household income and spending by household size), 2026 Q2 · Ministry of Data and Statistics, KOSIS · accessed 2026-10-25